Linear and quadratic functions
In this topic the stimulus is a function or a small business situation: a cost function with fixed costs, a price per unit, a parabola in one of its three forms, a line next to a parabola. Five statements follow, and anywhere from one to five of them are true. Almost every one is decided at one of a few places: the intercept, the slope, a zero, the vertex or a point of intersection (Schnittpunkt). If you know where these places sit in the equation of the function, there is little to calculate.
The formula sheet (Formelsammlung) gives you exactly one formula for this topic: number (1), the quadratic formula for with . It also gives four notations for bounded intervals, , , and , with which you write down a profit zone, for instance. Intervals with , as they occur for ranges and intervals of monotonicity, are not on it. It does not contain the equation of a line or the slope from two points, the vertex form, completing the square, the vertex position (Scheitelstelle) , or the rule by which the discriminant fixes the number of zeros; nor the terms fixed costs, revenue, profit and break-even point. The differentiation rules (2) to (10) are on the sheet, but you do not need them here: the vertex of a parabola gives its highest or lowest point without a derivative.
The article starts with the line and its business reading as cost, revenue and profit. Then comes the parabola: its forms, its vertex, its zeros, its common points with a line, and at the end the revenue that arises from a price-demand function. How to test a statement and refute it with a single counterexample is covered in the article on logic; here the subject is the calculations the statements depend on.
A linear function grows by the same amount at every step
A linear function has the form with real numbers and . Its graph is a straight line. Austrian textbooks call the two numbers and , German ones often and ; the meaning is the same.
The slope states how much the function value grows when increases by , and it is the same amount at every point: . If is negative, the function value falls by at every step.
The intercept (Achsenabschnitt) is the function value at zero, because . That is where the graph crosses the -axis. If two points and of the line are known, the slope is the quotient of the two increases:
One of the two points then gives the intercept. For the points and we get . Substituting the first point gives , so and . The check with the second point, , takes a moment and catches sign errors. Mind the order in the fraction: the increase of the function values goes on top, the increase of the inputs below. Dividing the other way round gives the reciprocal of the slope.
| Slope | Behaviour | Zeros |
|---|---|---|
| strictly increasing (streng monoton steigend) | exactly one | |
| strictly decreasing (streng monoton fallend) | exactly one | |
| constant, horizontal | none for , every point for |
A zero (Nullstelle) is the point where . For there is exactly one: from it follows that . For this is . In the same way you ask backwards for the input that gives a prescribed value: means , so . A line with is always monotonic, but increasing only when is positive.
Your turn1 of 12
A linear function has the value at and the value at . What is its equation?
In the simplest model, cost, revenue and profit are lines
The business problems of this topic always use the same terms. is the quantity, the number of units produced or sold, and all amounts are in euros.
Fixed costs arise no matter how much is produced: rent, insurance, the depreciation of a machine. They are the value of the cost function at quantity zero, so in a linear cost function they are the intercept .
Variable costs grow with the quantity, for example materials and energy. In the linear cost function they are , and the slope is called the variable cost per unit (variable Stückkosten): every additional unit makes production more expensive by exactly this amount.
Revenue (Erlös, also Umsatz) is what the sales bring in: price times quantity, so with a fixed price it is . Profit is revenue minus costs, . A negative profit is a loss.
An example. A firm has the costs and sells at a price of 18 euros per unit, so . The profit is
The bracket is not cosmetic: the minus applies to the whole cost function, so the fixed costs are subtracted too. The slope is the amount each unit sold leaves over after its variable costs. It is called the contribution margin per unit (Stückdeckungsbeitrag), because it contributes to covering the fixed costs. The difference of two linear functions is again linear, and its slope is the difference of the two slopes.
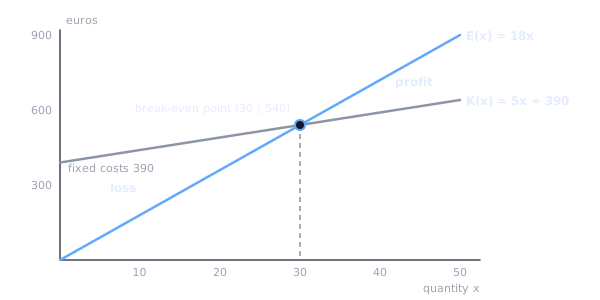
The break-even point (Gewinnschwelle) is the quantity at which revenue and costs are equal and the profit is zero. In the picture it is the point where the revenue line and the cost line intersect.
In the example, gives the break-even point . There and . Below it the firm makes a loss, above it a profit. So the break-even point comes from dividing the fixed costs by the contribution margin per unit, not by the price: would give about units, and there the profit is still clearly negative.
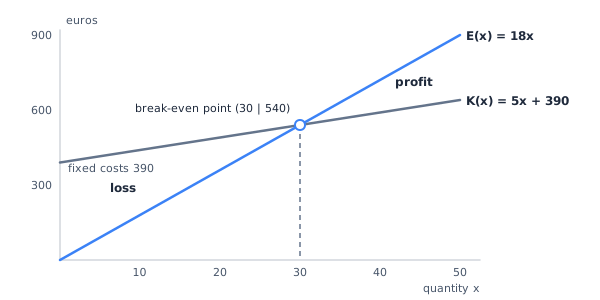
You can compute the profit at a given quantity in two ways, and the second serves as a check. At 50 units, . Equally: 50 units are 20 units above the break-even point, each of them brings 13 euros, and .
Your turn2 of 12
A good causes variable costs of 9 euros per unit and fixed costs of 630 euros; it sells for 16 euros per unit. Where is the break-even point?
With fixed costs a linear function is not proportional
A function is proportional if it has the form , so its line passes through the origin. Only then does twice the give twice the function value.
With an intercept this is lost. Twice the function value is , while the function value at twice the input is . The two differ by , because the intercept occurs only once. In the example and , not : the fixed costs of 390 euros do not arise twice at 20 units.
The average cost per unit (Stückkosten, also Durchschnittskosten) is the total cost divided by the quantity, . For a linear cost function this is : the fixed amount plus a share of the fixed costs that shrinks as the quantity grows.
Two quantities must therefore be kept apart. The increase per additional unit is the same everywhere for a linear cost function, namely . The average cost per unit, by contrast, falls with the quantity, because the fixed costs are spread over more units. In the example each additional unit costs 5 euros, while the average cost is euros at 10 units and euros at 30 units. That at 30 units it equals the price exactly is no accident: at the break-even point the price just covers the average cost of a unit.
Your turn3 of 12
For and every :
Two cost lines: left of the intersection the lower fixed costs win
Often two processes, tariffs or suppliers are compared. Let process A have the costs and process B the costs . A has the lower fixed costs, B the lower variable cost per unit.
Both cost the same where the lines intersect: gives , so , and there both cost euros. Which process is cheaper to the left and right of it is shown by the difference . It is negative for , where A is cheaper, and positive for , where B is cheaper. A numerical check on each side confirms this: at 10 units A costs and B euros, at 80 units A costs and B euros.
This gives a rule that needs no calculation. Two lines with different slopes intersect exactly once; to the left of the intersection the line with the larger slope lies below, to the right it lies above. If the lines have the same slope and different intercepts, they are parallel and never meet, and then one process is cheaper at every quantity. The claim that one of two processes with different slopes is cheaper at every quantity is therefore true only if the intersection lies outside the quantities under consideration, for example at a negative quantity.
Your turn4 of 12
A print shop can do a job with process A at a cost of or with process B at euros for units. For which quantities is B cheaper than A?
A quadratic function has three forms, and each shows something different
A quadratic function has the form with . Its graph is called a parabola (Parabel). If , a linear function is left.
The vertex is the lowest point of a parabola that opens upwards (nach oben offen) and the highest point of one that opens downwards (nach unten offen). The vertical line is its axis of symmetry (Symmetrieachse).
The same function can be written in three ways. In the exam one of them often appears in the stimulus and another in a statement, and you have to check whether both describe the same function.
| Form | Shape | What you read off at once |
|---|---|---|
| general form (allgemeine Form) | opening from , -intercept | |
| vertex form (Scheitelform) | vertex | |
| factored form (Produktform, Nullstellenform) | zeros and |
An example with all three forms:
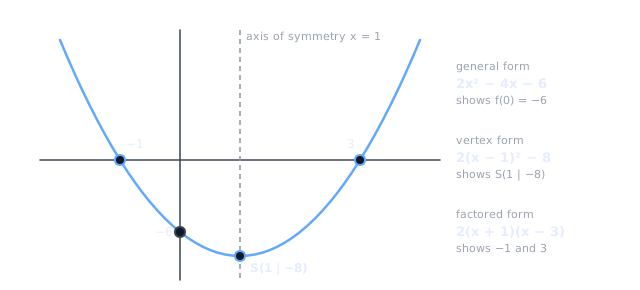
From the general form you read off that the parabola opens upwards () and crosses the -axis at . The vertex form shows the vertex , the factored form the zeros and . A factored form exists only if the function has real zeros. Whether two forms belong together you check by multiplying out: .
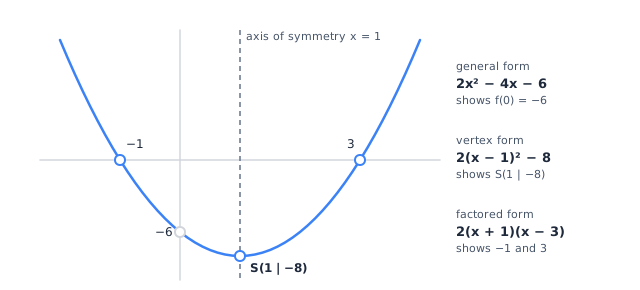
The signs inside the brackets are the most common source of errors. contains the vertex position , the zero : the number in the bracket appears with the opposite sign, because the bracket becomes zero exactly at that point. You may not drop the factor in any of the forms. has the same zeros as but is a different function: its vertex value (Scheitelwert) is , not .
The vertex form also describes a shift of the standard parabola (Normalparabel). If it is shifted to the right and upwards, the following equation results; shifts to the left and downwards correspond to negative and . So to the right means a minus in the bracket: the graph of reaches at the point the value that has at .
Shifting by to the left and upwards gives with the vertex , multiplied out . This parabola has no zeros: its lowest point lies at height above the -axis, and a square plus is never zero. The discriminant confirms it: .
Your turn5 of 12
A quadratic function is given in vertex form: . Which factored form describes the same function?
Completing the square gives the vertex
If the general form is given, you obtain the vertex form by completing the square (quadratische Ergänzung). The pattern is the binomial formula : half the coefficient of becomes , and is added and immediately subtracted again.
The vertex is . If , first factor out of the two terms containing :
The vertex is , and since it is a maximum point (Hochpunkt). Carrying out the same calculation with letters instead of numbers gives the vertex position as a formula:
This formula is not on the formula sheet. It is short enough to remember, and it contains a minus that is easily forgotten. For it gives and , so the same vertex. Two further routes lead to the vertex position without the formula: it lies exactly halfway between the two zeros, , and equally halfway between any two points at which the function has the same value.
Your turn6 of 12
Where is the vertex of ?
The sign of a decides the opening, the range and the monotonicity
| Property | ||
|---|---|---|
| opening | upwards | downwards |
| vertex | minimum point (Tiefpunkt), smallest value | maximum point, largest value |
| range (Wertebereich) | ||
| left of | strictly decreasing | strictly increasing |
| right of | strictly increasing | strictly decreasing |
The reason lies in the vertex form : the square is never negative and is zero only at . For something non-negative is always added to the vertex value, for it is subtracted. The larger , the narrower the parabola; the direction is determined by the sign alone.
For this means: the largest value is and is attained at , the range is , on the function is strictly increasing, on it is decreasing. It does not take arbitrarily large values, but it does take arbitrarily small ones. The formula sheet shows only bounded intervals; the notation with you have to know yourself: at there is always a round bracket, because is not a number that is attained. A statement that the parabola is monotonic on an interval containing the vertex position in its interior is always false.
The axis of symmetry saves work. At two points equally far to the left and right of the parabola has the same value: . For with we therefore have . Two special cases can be read off the coefficients. If , then and the graph is symmetric about the -axis. If , then and is a zero, because can be factored out of .
Three points with different inputs determine a parabola. Let , and be given. The point on the -axis immediately gives . The other two give and , so and . Adding the two equations gives , hence and , so . Check the result at all three points. And do not confuse given points with zeros: a point lies on the -axis only if .
Your turn7 of 12
What is the range of ?
Formula (1) gives the zeros, the discriminant gives their number
The zeros of a quadratic function are the solutions of . The formula for them is supplied as number (1):
For we have , and , so , and the zeros are and . The sign of enters : .
The discriminant is the expression under the root, . Its sign decides how many real zeros there are, before you take the root.
| Zeros | Picture | |
|---|---|---|
| two different ones | the parabola crosses the -axis twice | |
| one, counted twice | the vertex lies on the -axis | |
| no real one | the parabola lies entirely above or entirely below the -axis |
One example for each row: has and the zeros and ; has and only the zero ; has and none. If , and are whole numbers and is positive but not a perfect square, the zeros are irrational. A statement naming two whole numbers as zeros is then checked fastest by substituting: if one of the two numbers does not give zero, the statement is settled.
Not every equation needs the formula. If the constant term (absolutes Glied) is missing, factor out : has the zeros and . If the linear term is missing, solve for : gives and . And a function in factored form has its zeros already in the brackets, because a product is zero exactly when one factor is zero.
Between two zeros and outside them a parabola has a fixed sign, because the sign changes at a simple zero and nowhere else. A parabola that opens upwards is negative between its zeros and positive outside them, one that opens downwards the other way round. The factored form shows the reason: in both brackets are negative for , both positive for , and in between exactly one is negative.
Conversely, the factored form is built from the zeros. The zeros and belong to , where is the coefficient of . The zeros and with belong to . A wrong sign in one bracket gives itself away in the linear term when you multiply out.
Your turn8 of 12
The standard parabola is shifted to the left and downwards. Where are the zeros of the shifted parabola?
Your turn9 of 12
For with :
Parabola and line: the discriminant of the difference counts the common points
Common points of a parabola and a line are found by setting them equal. Bringing everything to one side gives . This is again a quadratic equation, because a line has no term with that could cancel the of the parabola. Its discriminant counts the common points.
| Discriminant of | common points | position |
|---|---|---|
| positive | two | the line cuts the parabola (schneiden) |
| zero | one | the line touches the parabola (berühren, tangent) |
| negative | none | the line passes the parabola by |
Take the parabola and the lines for different . Setting them equal gives with the discriminant .
- : . From we get and ; the points of intersection are and .
- : . From only follows; the line touches the parabola at the point .
- : . There is no common point.
Compute the second coordinate of a common point with the simpler of the two functions, usually the line, and check it with the other. The difference also tells you which curve lies on top: where it is positive, the parabola runs above the line. In the touching case , so the upward parabola lies above the line everywhere and meets it at only one point. If such a tangent is shifted upwards, two points of intersection appear; shifted downwards, none. For a downward parabola it is the other way round.
Your turn10 of 12
How many common points do the parabola and the line have?
A price-demand function turns revenue into a parabola
The price-demand function states at which price the quantity can be sold. It is decreasing: whoever wants to sell more has to offer at a lower price. Some problems state the relation the other way round, as the quantity sold depending on the price; the calculation is the same, only with the price as the variable.
With a price that depends on the quantity, the revenue is no longer linear. For we get
This is a downward parabola with the zeros and : without sales there is no revenue, and at a price of zero there is none either. Its vertex lies at , halfway between the zeros. The largest revenue is euros, at the price euros. Anyone who computes only the first term at the revenue maximum gets and forgets that the second is subtracted.
With the costs the profit is
Its vertex lies at , and the largest profit is euros. So profit reaches its maximum at a smaller quantity than revenue does. This is the rule and not a coincidence of this example: the variable costs lower the coefficient of from to , and with it the vertex position moves to the left. Put plainly, each additional unit brings less and less extra revenue but costs the same, and profit stops growing as soon as the extra revenue has fallen to the variable cost per unit of 3 euros.
The profit zone is the range of quantities at which the firm makes a profit. For a downward profit parabola it is the interval between its two zeros: the break-even point on the left and the profit limit (Gewinngrenze) on the right. Both notations occur: closed if the endpoints with zero profit count, and open if a strictly positive profit is meant.
In the example the fastest route is the vertex form . From it follows that , so and or . The profit zone is if the endpoints with zero profit are included, and if a strictly positive profit is required. In a statement, note which bracket is used and whether it speaks of profit or of no loss. The vertex position is not the right end of the profit zone but its middle, and at points equally far to the left and right of it the profit is the same: .
To the right of the vertex profit falls again, although more is sold: in the example 40 units bring only 90 euros of profit, while 30 units bring 120 euros. A statement that profit rises with the quantity holds for a profit parabola only to the left of the vertex. The same tools work wherever profit comes out as a downward parabola: the vertex for the maximum, the zeros for the profit zone.
Your turn11 of 12
For a product the price-demand function is and the costs are . Which statement is true?
Five statements: the cheapest check first
For this task format, what the logic article says applies: a statement is true if it holds for every admissible value, and a single value at which it fails refutes it. With functions this value is usually a function value you substitute. The checks, ordered by effort:
- Substitute. A claimed zero, a claimed function value or point is confirmed or refuted with one line of calculation.
- The point zero. is the -intercept and, for costs, the fixed costs; in the general form it is the constant term.
- The sign of . It decides the opening, largest or smallest value, the range and the sign between the zeros.
- The vertex position. or the midpoint of the zeros decides every statement about monotonicity, maximum and symmetry.
- The discriminant. It decides every statement about the number of zeros or common points without your computing the solutions.
A complete example. Let ; the vertex form is , the factored form .
- The graph crosses the -axis at . True: , the constant term.
- The largest function value is , attained at . True. Since , the vertex is a maximum point.
- On , is strictly increasing. False. The interval extends beyond the vertex position , and is smaller than .
- holds. True. Both points are at distance from the axis of symmetry ; both values are .
- Between the zeros and , is negative. False. The parabola opens downwards and is positive there, as already shows.
Four of the five decisions need no real calculation, only the constant term, the sign of and the position of the vertex.
Your turn12 of 12
Let . Which statement is true?
Common mistakes
- Forgetting the fixed costs. is not at units, and twice the quantity does not mean twice the costs.
- Dividing the fixed costs by the price. The break-even point is : fixed costs divided by the contribution margin per unit.
- The sign of the vertex position. It is , not , and contains the point .
- Taking the vertex height for the -intercept. The -intercept is , the vertex height is ; they are equal only when .
- Confusing touching and cutting. means one common point at which the line touches the parabola; two points exist only when .
- Taking the revenue maximum for the profit maximum. With variable costs, the largest profit lies at a smaller quantity than the largest revenue.
- Computing only one term at the maximum. The vertex value is with all three terms.
Key takeaways
- Line. In , is the fixed increase per unit and ; with the function is not proportional.
- Cost, revenue, profit. ; the break-even point is the zero of and the intersection of revenue and costs.
- Three forms of the parabola. The general form shows , the vertex form the vertex, the factored form the zeros; the sign of shows the opening.
- Vertex. Completing the square or , neither on the formula sheet; the axis of symmetry lies halfway between points with equal values.
- Discriminant. counts the zeros, and for the common points of parabola and line.
Was this article helpful?