Decoupling and Earth System Boundaries
The article on the economy inside society and environment showed that the economy takes inputs from the Earth system and returns outputs to it. This article asks the question that follows: can economic output keep growing without what is returned to the Earth system growing along with it?
The Skriptum answers in two parts. The first is called decoupling (Entkopplung) and describes how two quantities that have so far moved together can come apart. The second is called Earth system boundaries (Erdsystemgrenzen) and puts a figure on how much room is left at all. Both parts rest on the same distinction, and the article starts from it: growing more slowly and falling are not the same thing.
Both goals hang on the same quantity, and that is the dilemma
Economic growth, measured by gross domestic product (BIP) or by income, used to be tightly bound up with consuming more energy, more raw materials and more land, and with rising emissions. Where one quantity rose, the other rose with it. This coupling let the ecological footprint (ökologischer Fußabdruck) grow steadily, and it contributes substantially to several planetary boundaries having been crossed.
Out of this coupling grows a dilemma, and it has two halves, both of which hold. One half: growth counts as necessary, because it makes it possible to reduce poverty and finance public goods, and because employment, income security and social stability are traditionally tied to it. The other half: that same growth brings with it a resource and energy intensity that threatens ecological stability.
Note why this dilemma does not go away when politics picks one of the two sides. Give priority to the environmental goal, and the societal goals still hang on the very quantity that has just been limited. Give priority to growth, and the ecological burden stays. Both goals hang on a single quantity, and that is exactly why a way is sought to break the link rather than to choose between the goals.
Your turn1 of 18
A party wants to end the dilemma between growth and the environment by giving environmental protection clear priority over growth. Which objection is correct according to the article?
Decoupling breaks the link, not economic output
Decoupling means that two lines of development that have so far run together come apart: economic development on one side, environmental damage on the other. What is to be achieved is explicitly both at once. Prosperity, employment and quality of life remain secured, and resource consumption and emissions do not keep rising.
Two misreadings of this definition are tested regularly, and both come from reading only the environmental side.
The first: that decoupling means economic output and resource consumption fall together. That is nowhere in the text. Falling together would mean the two quantities still travel the same road, only downwards; the link between them would be entirely intact. What is to be broken is the link, not economic output.
The second: that decoupling is another word for giving up prosperity. That is not there either, quite the opposite. Prosperity, employment and quality of life are named explicitly as what must stay secured. Decoupling is desirable precisely because it joins societal wellbeing to ecological carrying capacity, and thereby allows economic activity to continue within the Earth system boundaries.
Your turn2 of 18
A teacher sums up decoupling like this: the economy should shrink so that emissions and resource consumption fall along with it. Which statement corrects him in the sense of the definition?
Two changes decide the form, not one number
Relative decoupling (relative Entkopplung) is present as long as environmental damage grows more slowly than economic output. Emissions and resource consumption therefore still rise, only more weakly than BIP. Absolute decoupling (absolute Entkopplung) is present when the environmental burden falls overall while economic output keeps rising. The first form changes the pace of the burden, the second changes its direction.
The Skriptum gives the same pair of numbers for both forms, and the reading rule can be taken from it. A country raises its BIP by 3 percent, while its CO₂ emissions rise by 1 percent: the burden keeps growing, but more slowly, and that is the relative form. A country raises its BIP by 3 percent, while its CO₂ emissions fall by 4 percent: the burden goes down while economic output goes up, and that is the absolute form.
Turn this into two questions, and ask them in this order.
- Is economic output rising? If not, neither form is present, whatever the emissions do.
- What is the environmental burden doing? It falls, so absolute decoupling. It rises more slowly than economic output, so relative decoupling. It rises just as fast or faster, so no decoupling at all.
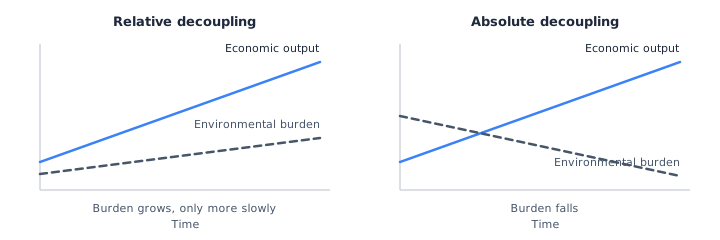
The table runs the rule through five cases. Read it by column and not by row: neither of the two numbers decides on its own.
| Economic output | Environmental burden | Which form | Why |
|---|---|---|---|
| +3% | +1% | relative decoupling | the burden grows, but more slowly than economic output |
| +3% | -4% | absolute decoupling | the burden falls, economic output rises |
| +1% | -1% | absolute decoupling | the same two conditions, only with weaker growth |
| +4% | +4% | no decoupling | the relationship between the two quantities is unchanged |
| -2% | -2% | no decoupling | economic output does not rise, the relationship stays as it was |
Your turn3 of 18
Four countries report the change in their BIP and their CO₂ emissions for the same year. Which country shows relative decoupling?
Neither the pace of growth nor a minus sign decides on its own
Exam statements go wrong in two places, and both times because a single number is read on its own.
First, the pace. A country whose BIP grows by 2 percent and whose emissions rise by 1 percent reaches the relative form. A country whose BIP grows by only 1 percent and whose emissions fall by 1 percent reaches the absolute form, the more demanding one, even though its economy grows more slowly. How fast a country grows says nothing about the form; what matters is how the two changes relate to each other.
Second, the sign on the emissions. Falling emissions alone are not yet decoupling. If economic output shrinks by 2 percent and emissions fall by 2 percent, then both quantities have fallen at the same rate, and the link between them is entirely intact. The declared goal argues against it too: prosperity, employment and quality of life are to stay secured, and a contraction meets the environmental half of that goal while failing its societal half.
The classification itself comes with a note. Both of the Skriptum's forms are stated for a growing economy; outside this Skriptum the literature has its own names for the case of a shrinking economy. The Skriptum knows only the two forms, and a shrinking economy falls under neither. What the exam tests is the Skriptum's classification.
Your turn4 of 18
In country X economic output grows by 2 percent and emissions rise by 1 percent. In country Y economic output grows by 1 percent and emissions fall by 1 percent. A commentary calls X the better case of decoupling, on the grounds that X grows faster. Which statement refutes the commentary?
Your turn5 of 18
An economy contracts by 2 percent, and its emissions fall by 2 percent over the same period. A newspaper then reports a successful absolute decoupling. Which statement speaks against this report?
Only the absolute form stops the remaining ecological room from being used up
Relative decoupling is progress, and it is the common case. It does not end what makes the problem a problem, though. As long as the burden keeps rising, the remaining ecological room keeps being used up, only more slowly than before. Using something up more slowly is not stopping.
Only the absolute form therefore ensures that economic development no longer comes at the cost of ecological stability. It is the more demanding of the two, because it does not merely lower the pace but reverses the direction.
For this reason the absolute decoupling of economic output from environmental consumption stands at the centre of green-growth strategies, such as the one the EU pursues with the European Green Deal. It is the only one of the two paths on which economic output can grow while the environmental burden falls. Whether it succeeds quickly and far enough is disputed: many ecological economists doubt it and rely in addition on sufficiency, on enough rather than ever more.
Your turn6 of 18
A country cuts the annual rise in its emissions from 3 percent to 1 percent while its BIP keeps growing by 3 percent. The government declares that the country is thereby no longer using up any ecological room. What is correct?
Emission intensity is a ratio and not a quantity
Emission intensity states how much CO₂ goes with one unit of economic output, that is, CO₂ emissions per unit of BIP. It is a ratio between two quantities and not a quantity itself: it answers how emission-heavy one unit of BIP is to produce, not how much is emitted in total.
This measure is the second shape of the same distinction, which is why it belongs here and not in an appendix. A falling emission intensity alongside still rising total emissions is exactly what relative decoupling describes: emissions grow more slowly than economic output, otherwise the ratio could not fall, and the direction of the total stays unchanged in the process.
From this follows the fallacy you have to guard against. A falling emission intensity does not imply that the environmental burden falls overall. Two movements work against each other: the ratio falls, the number of units rises. Which of the two wins decides the sign of the total, and for the climate it is the total that counts.
That is precisely what happened worldwide. Between 1990 and 2024, CO₂ emissions per unit of BIP fell globally by about 40 percent. Global total emissions nevertheless kept rising over the same period, because economic growth overcompensated the efficiency gains. The efficiency gains were therefore real and still not enough.
How far short they fell is shown by a second figure. According to Global Carbon Budget estimates, global CO₂ intensity would have to fall by 8-9 percent a year; the actual rate is currently below 2 percent. Check how the two figures fit together yourself: about 40 percent over a good three decades is close to one and a half percent a year, and that fits the rate of below 2 percent given for today.
Your turn7 of 18
In a country, CO₂ emissions per unit of economic output fall markedly, yet total emissions keep rising. A student therefore takes one of the two measurements to be faulty. Which statement resolves the apparent contradiction?
Relative decoupling is widespread, absolute decoupling stays the exception
The empirical picture is mixed, and it fits into one sentence: many countries have so far achieved relative decoupling, while absolute decoupling is demonstrable only in a few areas and states. Some countries are even strengthening the coupling between BIP and emissions further.
Between 1990 and 2024, around 30 countries, mainly in the EU and in North America, reduced their CO₂ emissions in absolute terms while their BIP kept growing. Some wealthy states, such as the Scandinavian countries or the United Kingdom, have thereby achieved a partial absolute decoupling of BIP and CO₂ emissions.
Draw the right conclusion from this, and only that one. The evidence refutes the objection that absolute decoupling is impossible in principle; it has happened. It does not refute the objection that it is going too slowly. Even in these countries the reduction rates are so far not enough to reach net zero emissions by 2040 in the industrialised countries and by 2050 globally. What has been achieved is the direction, not the pace.
Your turn8 of 18
In a debate, A says: absolute decoupling of BIP and CO₂ is impossible. B says: it exists, but it is too slow. Around 30 countries cut their CO₂ emissions between 1990 and 2024 while their BIP grew. What follows from this finding?
For SO₂ and CFCs the technology at the end of the chain worked, for CO₂ it does not
Why absolute decoupling succeeded for some pollutants and hardly at all for CO₂ comes down to a single property: whether the pollutant can be captured at the end of the production process or replaced by another substance.
| Question | Sulphur dioxide (SO₂) and CFCs | Carbon dioxide (CO₂) |
|---|---|---|
| Technology at the end of the chain | end-of-pipe methods such as filters, plus substitution by milder substances | no large-scalable technology that fully neutralises the emissions |
| Relation to value creation | the substance is a by-product that can be separated out | the emissions hang on energy consumption, the core of industrial value creation |
| What politics added | international environmental agreements | pricing and subsidies, but no substitute substance |
| Result | absolute reductions in many countries | absolute reductions only in isolated cases |
For carbon dioxide there is Carbon Capture and Storage (CCS), and the difference can be read off it precisely. Technically the method is entirely possible. What it founders on so far is cost, its own energy demand and limited applicability, not feasibility. In Austria, CCS is therefore not permitted in general but only for hard-to-abate branches: for areas where no economically competitive carbon-free alternatives are currently expected to exist by 2040, such as parts of the waste and cement industry and aviation.
One qualification belongs here, and it is readily overlooked. The electrification of mobility, logistics and heat generation leads to efficiency gains and thereby to falling energy demand. It has nevertheless not dissolved the link: in industrial production, greenhouse gas emissions stay tightly tied to energy consumption. Where the pollutant cannot be caught at the end of the chain, the chain itself has to be changed.
Your turn9 of 18
A member of parliament argues: with sulphur dioxide, filters brought absolute decoupling, so it will succeed for CO₂ in the same way. Which statement speaks against this conclusion?
A reported cut can come from where the balance sheet stops
Carbon leakage means the relocation of production, and of the emissions that come with it, to other world regions, above all to countries with less strict standards. Emissions are counted where production takes place. When production moves away, one country's balance falls without the world emitting any less.
Even in countries with falling emissions, part of the reduction is due to such relocations. That does not make the national balance worthless, but it does make it incomplete: whether a reported reduction is real can only be judged once production abroad is taken into account as well.
One sign is easy to spot. If part of the basic materials industry leaves the country while imports of the same goods rise, then demand has stayed and manufacturing has moved. The domestic balance falls without anyone having changed their behaviour, and the worldwide quantity of emissions can stay the same: what is relocated is the site, not the demand.
Two confusions suggest themselves. Carbon leakage does not arise from transporting the imported goods; the traffic comes on top, but it is not what the term is about. And the emissions of the imported goods do not appear in the domestic balance, because counting happens at the place of production. That is exactly why a national balance can fall while nothing is saved worldwide.
Your turn10 of 18
An industrialised country reports falling emissions over a decade. Over the same period part of its basic materials industry has left the country, and imports of the same goods have risen. The government speaks of a contribution to global climate protection. Which statement calls that into question?
An efficiency gain is partly consumed again
The rebound effect is the process by which an efficiency gain is eaten up again through heavier use. More efficient technologies lower the cost of using them, and what gets cheaper is demanded more often. At the end stands a higher total demand for energy and goods, and only part of the saved consumption survives.
Note the direction of the effect, because exam statements like to reverse it. The rebound effect is not a fall in energy demand as efficiency rises, but a rise in it. Falling costs are what sets the whole chain off.
An example makes it visible. A business swaps its lighting for more economical technology; electricity use per hour falls markedly. A year later the lights burn longer and in more rooms, and total consumption is barely below the old value. The efficiency measurement at the device is perfectly correct throughout, it simply answers a different question: consumption per hour and consumption per year are two quantities that can move independently of each other.
Two further observations hang on this. The effect arises in the behaviour of the users and not in the technology, which is why nothing about it can be read off the device itself. And part of the gain is cancelled, not necessarily all of it: a residual saving usually remains, and even so the efficiency gain alone is not enough.
Your turn11 of 18
A business replaces its lighting with more economical technology. Consumption per hour falls markedly, and a year later total consumption is barely below the old value. The manager suspects a faulty meter. Which statement accounts for this course of events without a measurement error?
Absolute decoupling demands three levels at once
From carbon leakage and the rebound effect follows the central sentence of this section: technology is only one part of the task. Its core lies where structures and institutions lie, and that is exactly why it is called a structural and institutional challenge. Innovation in technology alone will not solve it.
The Skriptum names three preconditions, and it names them as a list rather than as a choice.
| Level | What belongs to it | Example |
|---|---|---|
| political measures | CO₂ pricing, support instruments for renewable energy | a levy on emissions, subsidies for wind power |
| system transformations | rebuilding the energy, mobility and food systems | rebuilding the rail network |
| behavioural change | changed behaviour at consumer level and at company level | a campaign for more plant-based nutrition |
Two points about this table are tested. First, the assignment: CO₂ pricing sits under political measures and not under behavioural change, even though it works through behaviour. It changes the conditions under which decisions are made, not the decision itself. Second, how the three levels relate to each other: none replaces the others. A package of a levy, rail expansion and subsidies does not make behavioural change dispensable, since that stands alongside as a condition of its own. The question of the single best measure is therefore the wrong question.
Note as well how far the system transformations reach. The energy, mobility and food systems are named alongside one another as equals. The task thereby reaches into an area often treated as a matter of private taste, and what it demands there is not a better device but a different construction of the whole system.
Your turn12 of 18
A government introduces a CO₂ levy, expands the rail network and subsidises wind power. It considers every precondition of absolute decoupling thereby met. What is missing according to the Skriptum?
The room that is left is a cumulative quantity
So far the article has been about how burden and economic output move relative to each other. Now it is about how much burden is left at all. To operate within the Earth system boundaries means, for example, staying within the remaining carbon budget.
The carbon budget is the maximum amount of carbon dioxide (CO₂) that may still be emitted worldwide if a set warming limit is to be kept, such as the 1.5 °C or the 2 °C above the pre-industrial level from the Paris climate targets. Behind it stands the scientifically described relationship between cumulative greenhouse gas emissions and global warming. The budget is stated in gigatonnes of CO₂ (GtCO₂), and it serves as a guide value for how climate protection measures and reduction targets are set.
Pick out the three features on which exam statements turn.
It is, first, a cumulative quantity and not a rate. What is stated is a mass in gigatonnes, because warming depends on the sum of past emissions and not on how fast emissions are happening right now. A remaining budget therefore shrinks with every emission and is never refilled. Only because it behaves that way is it possible to say at all in how many years it would be used up at an unchanged rate of emission.
It is, second, a global figure. The remaining carbon budget for 1.5 °C is 380 billion tonnes of CO₂, and that figure applies to humanity as a whole, not to a single country. At the current rate of emission it would be used up in just nine years. How a global quantity is divided among states is a separate, political question.
It is, third, a statement about risk and not a guarantee. The remaining budget for 1.5 °C is tied to a probability of 50 percent: it names the amount at which warming stays below the limit with that probability. Someone who keeps within the budget can therefore still cross the limit.
At this point the circle closes back to the first half of the article. Because the budget is cumulative, relative decoupling is too little: emissions that grow more slowly still use the budget up, merely at a lower pace. To stop using it up would mean bringing emissions to zero.
Your turn13 of 18
A worked example with round numbers: the worldwide remaining budget for a warming limit is 300 GtCO₂. In the first year 40 GtCO₂ are emitted, in the second year only 38 GtCO₂. How large is the remaining budget at the end of the second year?
Falling emissions and a sufficient contribution are two statements
In Austria, greenhouse gas emissions began to fall for the first time in 2022. That is how the WU text puts it, and that is how it is examined; in some earlier years, such as 2020, emissions had in fact also fallen. The reduction does not, however, match the Effort-Sharing-Verordnung, which demands from every state an appropriate contribution to the reduction of global greenhouse gases.
Keep the two statements apart, because they are regularly pulled together. One describes the direction of the change, the other its extent. A reduction can be real and at the same time insufficient, and that is exactly the case being described here.
That also settles what the extent is measured against. Not against a comparison with the country's own previous year, because such a comparison does not judge the starting level. The yardstick is an appropriate share of the global reduction, and the Effort-Sharing-Verordnung is the instrument that translates the global figure into expectations of individual states. A division does not follow by itself from a globally valid budget, but the framework in which it is negotiated does.
Your turn14 of 18
An EU state cuts its greenhouse gas emissions by 0.5 percent compared with the previous year. The environment minister considers the Effort-Sharing-Verordnung thereby met. What is wrong with this conclusion?
The 1.5 degree limit is chosen, not measured
The 1.5 degree limit is often treated as a critical threshold of climate change, as though it were read off physics. Johan Rockström and other climate researchers argue otherwise: it represents less a fixed Earth system boundary than a political declaration of intent.
The difference lies in where the number comes from. Planetary boundaries are the outcome of many-layered interactions: biophysical and societal processes mesh with one another in them. Behind the 1.5 degree target stands something else, namely political decision-making resting on scientific risk assessments. The mark became an international climate goal in the Paris Agreement (2015), and what shaped that choice above all was the pressure of particularly vulnerable states.
Note that both things are true at once here. Politically chosen does not mean without a scientific basis. Scientific studies, above all the IPCC special report (2018), showed that warming of 1.5 °C alone would have significant negative consequences for people and the environment, among them intensified extreme weather events, sea level rise, species extinction and falling harvests. Politically chosen means here: not readable off physics. The threshold thereby marks not a safe area but the limit of the risk one is still willing to take.
Your turn15 of 18
A commentator writes that the 1.5 degree limit is read off physics, like the boiling point of water. Which statement refutes him?
Uncertainty about the tipping elements argues for caution
The 1.5 degree limit gains particular importance through the tipping elements of the Earth system.
Tipping elements are components of the Earth system that can undergo irreversible changes under sustained warming. They include the Greenland and the West Antarctic ice sheets, the Atlantic overturning circulation and tropical coral reefs.
Whether a system belongs among them is decided by whether it can tip under sustained warming, and not by its extent. Tropical coral reefs therefore stand in the same list as the ice sheets. And what matters about them is not that they change, but that these changes do not reverse themselves when it later grows cooler again.
A joint flip at one fixed threshold is not what the state of research describes. Numerous studies suggest that tipping elements can enter critical phases already in the range of 1.5 to 2 °C; some may become unstable only at higher temperatures. There is therefore no single number at which they all tip together.
Out of this uncertainty follows the opposite of complacency. Because the exact thresholds are unknown and the changes would be beyond recall, a conservative approach is required, and for that very reason the 1.5 degree limit was chosen as the yardstick for climate protection measures. Anyone who infers from the uncertainty that the limit may be set higher turns the argument on its head: the less is known about the threshold, the less one may approach it.
Your turn16 of 18
An economist writes: since nobody knows exactly at what temperature the tipping elements flip, the climate limit can safely be set higher than 1.5 degrees. Which statement refutes him?
The climate is one of nine Earth system boundaries
The Earth system boundaries, also called planetary boundaries, are nine central processes on which the resilience of the Earth system is decided, and for each of which a boundary has been identified, quantified and set. What this marks out is a safe operating space (sicherer Handlungsraum): the area within which socio-economic activities can develop without endangering the stability of planetary systems. The concept was developed by Johan Rockström and colleagues.
Two properties of this concept matter more than the list itself. The first: the boundaries were not merely named but quantified. Only that turns a warning into a checkable statement, since without a figure there would be no saying whether a boundary has been crossed. The second: the safe operating space is not a ban on activity but a frame for it. Within that space one can do business without endangering the stability of planetary systems.
Crossed, moreover, does not mean merely ecologically questionable. What crossing means for people is stated outright. Clean water becomes inaccessible; food security falls; ecosystems grow less stable; and jobs are lost where temperatures rise or floods arrive. The list reaches into the labour market, and that is why Earth system boundaries are not a purely natural-science topic but one of economic livelihoods.
All nine boundaries were first quantified in Science in 2023; at that time six counted as crossed. The Planetary Health Check 2025 counts seven, because ocean acidification has since crossed its boundary as well. The table shows this state.
| Earth system boundary | Status | What the Skriptum bases it on |
|---|---|---|
| climate system | crossed | warming of about 1.2 °C, CO₂ concentration above 420 ppm |
| integrity of the biosphere | crossed | species extinction rates above a hundredfold of the natural level |
| land use change | crossed | over 40% of the ice-free land surface used for agriculture |
| nitrogen and phosphorus cycles | crossed | eutrophication and soil salinisation widespread |
| freshwater availability | crossed | water withdrawals above regenerative capacity |
| introduction of novel substances | crossed | chemicals, microplastics and pesticides in the environment and food chains |
| ocean acidification | crossed | a pH drop of more than 0.1 since 1850 |
| stratospheric ozone | within the safe area | regeneration after the Montreal Protocol |
| atmospheric aerosol loading | within the safe area | globally within tolerance, regionally already critical |
Three rows of this table deserve more attention than the other six. Stratospheric ozone shows that a development can be reversible: international politics worked here, and the ozone layer is regenerating. Aerosol loading shows how a global average can hide the situation of individual areas, since aggregated globally it lies within tolerance while regionally it is already critical. And the climate system stands here as one row out of nine: it is the best known of the boundaries, but not the only one and not the only one crossed.
The names themselves come with a warning, because the Skriptum is inconsistent here. The same boundaries are called different things on two neighbouring pages: Übersäuerung next to Versauerung der Ozeane, Verfügbarkeit von Oberflächen- und Grundwasser next to Süßwasserverfügbarkeit, Einbringung neuer Substanzen und Organismen next to Einbringung neuartiger Substanzen. The nitrogen and phosphorus cycles are run in the text as biochemische Kreisläufe, while the accompanying figure labels them biogeochemical flows; biogeochemical is the usual term outside the Skriptum. Remember which processes are meant, therefore, and hang nothing on the exact spelling of a name.
Your turn17 of 18
A report concludes: atmospheric aerosol loading lies in the safe zone, so there is no problem with aerosols regionally either. What is wrong with this conclusion?
Because the boundaries are connected, none can be solved on its own
The Earth system comprises many interlinked processes, among them the global carbon cycle, biological diversity and the chemical composition of the atmosphere. These processes secure the stability and habitability of the planet jointly; none of them carries the result on its own.
If certain biophysical thresholds are crossed, that can lead to changes which cannot be reversed. The system does not disappear in the process, it changes its state, and the new state is less stable than the previous one and harder for human societies to inhabit. And because one process holds on to the next, a crossed boundary rarely stays where it was crossed: it breaks through into other areas.
What this looks like is shown by a chain that the Skriptum spells out: climate change leads to a loss of biodiversity, the loss of biodiversity to lower CO₂ storage, the lower storage to a further rise in temperature. The start of the chain turns out to be its result as well, and such feedbacks amplify when several systems cross critical thresholds at the same time. That is exactly the state the Earth is currently in, the global risk zone.
From this follows the sentence towards which this chapter runs. Whoever wants to manage the climate crisis will have to keep the other planetary boundaries intact as well. A policy that lowers emissions alone while continuing to use up soils, water and species diversity works against its own goal.
Your turn18 of 18
A government wants to solve the climate crisis through falling emissions alone and accepts that soils, water and biodiversity continue to be used up. Which statement speaks against this plan?
Was this article helpful?